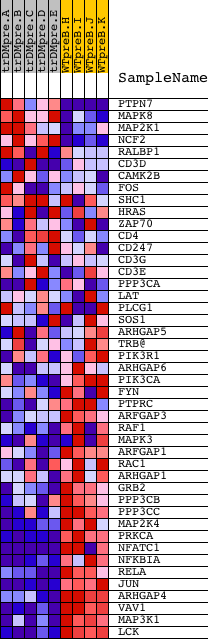
Profile of the Running ES Score & Positions of GeneSet Members on the Rank Ordered List
| Dataset | Set_04_transDMpreB_versus_WTpreB.phenotype_transDMpreB_versus_WTpreB.cls #transDMpreB_versus_WTpreB |
| Phenotype | phenotype_transDMpreB_versus_WTpreB.cls#transDMpreB_versus_WTpreB |
| Upregulated in class | WTpreB |
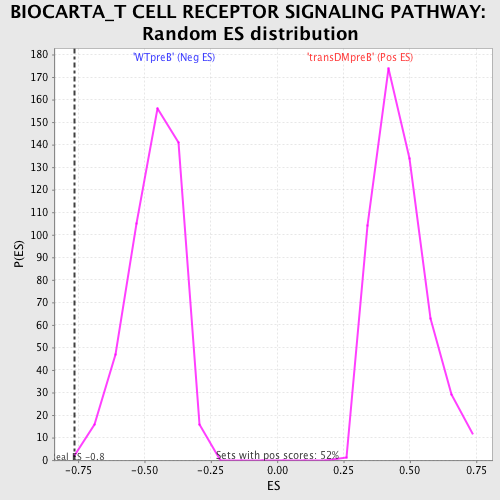
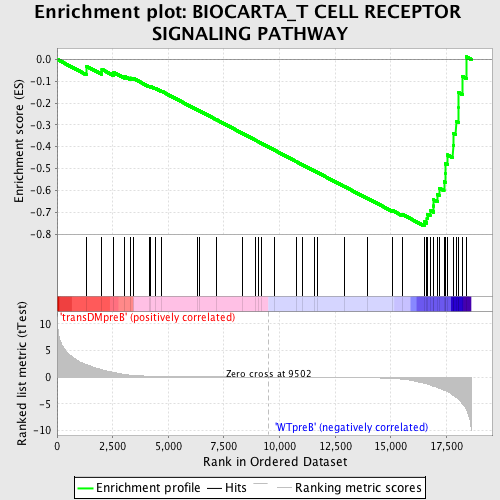
| GeneSet | BIOCARTA_T CELL RECEPTOR SIGNALING PATHWAY |
| Enrichment Score (ES) | -0.7630931 |
| Normalized Enrichment Score (NES) | -1.6500236 |
| Nominal p-value | 0.0020703934 |
| FDR q-value | 0.0309798 |
| FWER p-Value | 0.283 |
| PROBE | DESCRIPTION (from dataset) | GENE SYMBOL | GENE_TITLE | RANK IN GENE LIST | RANK METRIC SCORE | RUNNING ES | CORE ENRICHMENT | |
|---|---|---|---|---|---|---|---|---|
| 1 | PTPN7 | 11500 | 1312 | 2.372 | -0.0312 | No | ||
| 2 | MAPK8 | 6459 | 2014 | 1.381 | -0.0460 | No | ||
| 3 | MAP2K1 | 19082 | 2547 | 0.862 | -0.0603 | No | ||
| 4 | NCF2 | 14098 5151 9446 | 3023 | 0.504 | -0.0775 | No | ||
| 5 | RALBP1 | 9725 | 3289 | 0.378 | -0.0855 | No | ||
| 6 | CD3D | 19473 | 3436 | 0.320 | -0.0880 | No | ||
| 7 | CAMK2B | 20536 | 4132 | 0.173 | -0.1226 | No | ||
| 8 | FOS | 21202 | 4219 | 0.162 | -0.1245 | No | ||
| 9 | SHC1 | 9813 9812 5430 | 4421 | 0.139 | -0.1330 | No | ||
| 10 | HRAS | 4868 | 4707 | 0.115 | -0.1465 | No | ||
| 11 | ZAP70 | 14271 4042 | 6321 | 0.048 | -0.2325 | No | ||
| 12 | CD4 | 16999 | 6410 | 0.046 | -0.2365 | No | ||
| 13 | CD247 | 4498 8715 | 7180 | 0.032 | -0.2774 | No | ||
| 14 | CD3G | 19139 | 8313 | 0.015 | -0.3381 | No | ||
| 15 | CD3E | 8714 | 8903 | 0.008 | -0.3697 | No | ||
| 16 | PPP3CA | 1863 5284 | 9030 | 0.006 | -0.3763 | No | ||
| 17 | LAT | 17643 | 9183 | 0.004 | -0.3844 | No | ||
| 18 | PLCG1 | 14753 | 9775 | -0.004 | -0.4162 | No | ||
| 19 | SOS1 | 5476 | 10751 | -0.016 | -0.4684 | No | ||
| 20 | ARHGAP5 | 4412 8625 | 11027 | -0.020 | -0.4829 | No | ||
| 21 | TRB@ | 1157 | 11556 | -0.028 | -0.5109 | No | ||
| 22 | PIK3R1 | 3170 | 11694 | -0.031 | -0.5177 | No | ||
| 23 | ARHGAP6 | 24207 | 12930 | -0.059 | -0.5833 | No | ||
| 24 | PIK3CA | 9562 | 13936 | -0.107 | -0.6356 | No | ||
| 25 | FYN | 3375 3395 20052 | 15076 | -0.254 | -0.6927 | No | ||
| 26 | PTPRC | 5327 9662 | 15502 | -0.380 | -0.7092 | No | ||
| 27 | ARFGAP3 | 22183 | 16503 | -1.128 | -0.7443 | Yes | ||
| 28 | RAF1 | 17035 | 16625 | -1.259 | -0.7299 | Yes | ||
| 29 | MAPK3 | 6458 11170 | 16645 | -1.295 | -0.7094 | Yes | ||
| 30 | ARFGAP1 | 14705 2854 | 16766 | -1.469 | -0.6914 | Yes | ||
| 31 | RAC1 | 16302 | 16919 | -1.693 | -0.6715 | Yes | ||
| 32 | ARHGAP1 | 6001 10448 | 16928 | -1.706 | -0.6435 | Yes | ||
| 33 | GRB2 | 20149 | 17099 | -1.953 | -0.6202 | Yes | ||
| 34 | PPP3CB | 5285 | 17175 | -2.093 | -0.5895 | Yes | ||
| 35 | PPP3CC | 21763 | 17392 | -2.468 | -0.5601 | Yes | ||
| 36 | MAP2K4 | 20405 | 17452 | -2.546 | -0.5209 | Yes | ||
| 37 | PRKCA | 20174 | 17460 | -2.570 | -0.4786 | Yes | ||
| 38 | NFATC1 | 23398 1999 5167 9455 1985 1957 | 17547 | -2.734 | -0.4377 | Yes | ||
| 39 | NFKBIA | 21065 | 17794 | -3.356 | -0.3952 | Yes | ||
| 40 | RELA | 23783 | 17808 | -3.389 | -0.3395 | Yes | ||
| 41 | JUN | 15832 | 17929 | -3.751 | -0.2836 | Yes | ||
| 42 | ARHGAP4 | 9343 | 18048 | -4.114 | -0.2216 | Yes | ||
| 43 | VAV1 | 23173 | 18053 | -4.129 | -0.1531 | Yes | ||
| 44 | MAP3K1 | 21348 | 18225 | -4.997 | -0.0792 | Yes | ||
| 45 | LCK | 15746 | 18405 | -6.029 | 0.0114 | Yes |